DEVELOPMENT RANKINGS · NCAA D3 MEN'S TRACK & FIELD
Which programs make runners faster?
Every D3 program, ranked by what its athletes actually ran, jumped and threw as juniors and seniors compared with their first college season, and measured against athletes at other D3 programs who started at the same mark. Distance, sprints, hurdles, jumps and throws. Real marks, real sample sizes, nothing hidden.
D3 men whose first college season was 4:11 or faster in the 1500m, 2:00.5 in the 800m or 15:40 in the 5000m: the fastest 25% of the division. 80 programs ranked (needs 6 junior-year marks).
Faster / slower is how this program’s runners finished compared with runners at other programs who started college with the same times, across all three events and shown as seconds in a 1500m. “3.0s faster” means a 1500m runner here ended up about 3 seconds ahead of where a similar runner elsewhere did.
 Pomona Pitzer8 marks from 5 athletes · small sample2.7s faster1500m4:02.9 → 3:58.0800m–5000m14:50 → 14:29Still racing71%
 Wis La Crosse9 marks from 9 athletes · small sample2.2s faster1500m3:59.6 → 3:48.8800m–5000m14:37 → 14:24Still racing62%
 Wesleyan17 marks from 11 athletes1.7s faster1500m4:03.5 → 4:00.7800m1:58.6 → 1:54.45000m15:10 → 14:41Still racing100%
 Loras11 marks from 8 athletes1.5s faster1500m4:02.5 → 4:00.5800m1:56.8 → 1:54.55000m15:35 → 14:60Still racing80%
 Wartburg28 marks from 18 athletes1.4s faster1500m4:01.4 → 4:00.8800m1:54.5 → 1:53.75000m15:07 → 14:41Still racing95%
 Wittenberg6 marks from 4 athletes · small sample1.3s faster1500m–800m–5000m15:13 → 14:52Still racing80%
 Wis Platteville12 marks from 10 athletes1.3s faster1500m4:04.3 → 4:03.9800m1:59.0 → 1:56.85000m15:08 → 14:36Still racing91%
 St Olaf22 marks from 19 athletes1.3s faster1500m4:07.8 → 3:59.6800m1:58.1 → 1:57.45000m15:15 → 14:45Still racing90%
 MIT24 marks from 20 athletes1.3s faster1500m3:57.9 → 3:52.9800m1:54.9 → 1:54.15000m14:60 → 14:52Still racing75%
 Haverford15 marks from 8 athletes1.2s faster1500m4:02.8 → 3:58.9800m1:58.2 → 1:57.75000m15:25 → 14:57Still racing89%
 Johns Hopkins25 marks from 16 athletes1.1s faster1500m4:02.9 → 3:59.9800m1:55.5 → 1:54.45000m15:02 → 14:39Still racing81%
 RPI37 marks from 22 athletes1.0s faster1500m4:05.5 → 4:00.5800m1:55.4 → 1:53.05000m15:08 → 14:53Still racing88%
 Tufts19 marks from 15 athletes1.0s faster1500m3:59.6 → 3:56.0800m1:57.9 → 1:56.95000m15:07 → 14:44Still racing63%
 NYU17 marks from 12 athletes0.9s faster1500m4:03.8 → 3:59.1800m1:55.3 → 1:56.35000m15:04 → 14:37Still racing86%
 George Fox21 marks from 13 athletes0.9s faster1500m4:03.8 → 4:01.5800m1:57.8 → 1:58.95000m15:24 → 15:03Still racing78%
 Milwaukee Sch of Eng11 marks from 8 athletes0.9s faster1500m4:03.7 → 3:56.5800m1:55.5 → 1:52.55000m15:19 → 15:14Still racing82%
 Rose Hulman6 marks from 6 athletes · small sample0.8s faster1500m4:08.2 → 3:59.7800m1:58.2 → 1:57.05000m–Still racing89%
 North Central IL18 marks from 12 athletes0.5s faster1500m4:06.2 → 4:00.5800m1:59.3 → 1:56.95000m15:14 → 15:08Still racing76%
 Lewis & Clark8 marks from 4 athletes · small sample0.5s faster1500m4:02.8 → 3:56.2800m–5000m–Still racing60%
 Colorado College8 marks from 7 athletes · small sample0.5s faster1500m–800m1:56.9 → 1:57.75000m15:23 → 14:46Still racing58%
 Moravian10 marks from 7 athletes0.5s faster1500m4:05.6 → 4:00.4800m1:57.5 → 1:57.75000m15:29 → 15:15Still racing100%
 Ohio Northern11 marks from 6 athletes0.4s faster1500m4:05.1 → 3:59.2800m–5000m15:19 → 15:03Still racing100%
 Wis Oshkosh12 marks from 10 athletes0.4s faster1500m4:04.2 → 3:58.8800m1:56.7 → 1:54.15000m15:21 → 15:09Still racing100%
 Whitworth10 marks from 6 athletes0.4s faster1500m4:01.3 → 3:59.0800m2:00.2 → 1:58.15000m15:31 → 15:27Still racing88%
 Lebanon Valley7 marks from 6 athletes · small sample0.3s faster1500m–800m1:55.1 → 1:54.25000m15:26 → 14:50Still racing75%
 Brockport St8 marks from 5 athletes · small sample0.3s faster1500m4:03.8 → 3:57.8800m1:56.9 → 1:57.85000m–Still racing100%
 Bates18 marks from 11 athletes0.2s faster1500m4:02.9 → 4:00.6800m1:56.7 → 1:54.65000m–Still racing85%
 UC Santa Cruz20 marks from 12 athletes0.1s faster1500m4:04.6 → 4:03.3800m1:56.0 → 1:54.25000m15:20 → 14:59Still racing68%
 Claremont Mudd Scripps12 marks from 9 athletes0.1s faster1500m4:07.4 → 4:12.8800m1:57.0 → 1:56.85000m15:36 → 15:15Still racing60%
 U of Chicago16 marks from 11 athletes0.1s faster1500m4:06.1 → 4:02.9800m1:57.0 → 1:54.05000m14:55 → 14:60Still racing73%
 Wis Stout11 marks from 8 athletes0.1s slower1500m4:04.7 → 4:04.3800m–5000m15:11 → 14:42Still racing47%
 Wis Whitewater16 marks from 13 athletes0.1s slower1500m4:04.8 → 4:02.9800m1:56.7 → 1:53.85000m15:11 → 14:48Still racing100%
 Mount Union17 marks from 11 athletes0.3s slower1500m4:05.1 → 4:01.0800m1:57.0 → 1:57.15000m15:19 → 15:14Still racing85%
 Rowan18 marks from 12 athletes0.3s slower1500m4:07.4 → 4:05.8800m1:55.9 → 1:57.55000m15:08 → 14:53Still racing75%
 Occidental9 marks from 6 athletes · small sample0.4s slower1500m4:01.1 → 4:01.0800m–5000m–Still racing88%
 Swarthmore10 marks from 9 athletes0.4s slower1500m4:04.3 → 3:59.6800m1:59.7 → 1:59.85000m15:21 → 15:36Still racing90%
 Chapman6 marks from 3 athletes · small sample0.5s slower1500m4:07.0 → 3:58.7800m–5000m–Still racing60%
 Wabash7 marks from 5 athletes · small sample0.6s slower1500m–800m1:54.1 → 1:55.05000m–Still racing100%
 Geneseo St30 marks from 18 athletes0.6s slower1500m4:02.6 → 4:01.5800m1:56.7 → 1:56.15000m15:18 → 14:34Still racing90%
 Macalester6 marks from 6 athletes · small sample0.6s slower1500m4:09.5 → 4:03.1800m–5000m–Still racing100%
 St Johns MN14 marks from 9 athletes0.6s slower1500m4:04.2 → 4:01.0800m1:57.9 → 1:55.75000m15:24 → 15:10Still racing100%
 Bowdoin10 marks from 6 athletes0.6s slower1500m4:01.8 → 4:00.9800m1:51.6 → 1:52.35000m14:56 → 14:40Still racing75%
 DePauw6 marks from 5 athletes · small sample0.7s slower1500m–800m–5000m15:28 → 15:03Still racing62%
 Hope15 marks from 9 athletes0.9s slower1500m4:02.3 → 4:02.5800m1:57.5 → 1:56.05000m15:06 → 14:48Still racing100%
 Otterbein10 marks from 7 athletes0.9s slower1500m4:09.3 → 4:01.7800m1:59.1 → 1:58.05000m15:36 → 15:39Still racing78%
 Calvin6 marks from 5 athletes · small sample0.9s slower1500m–800m–5000m15:04 → 14:58Still racing86%
 Carnegie Mellon20 marks from 15 athletes1.0s slower1500m3:55.5 → 3:56.7800m1:58.3 → 1:56.35000m15:07 → 15:02Still racing94%
 TCNJ16 marks from 9 athletes1.0s slower1500m4:02.9 → 4:01.3800m1:57.1 → 1:59.75000m15:11 → 15:03Still racing82%
 Brandeis7 marks from 7 athletes · small sample1.0s slower1500m4:06.1 → 4:02.9800m1:56.8 → 1:57.75000m–Still racing100%
 Gustavus Adolphus9 marks from 7 athletes · small sample1.1s slower1500m–800m1:57.7 → 1:57.65000m–Still racing100%
 Emory23 marks from 15 athletes1.1s slower1500m4:04.0 → 4:01.0800m1:57.7 → 1:56.35000m15:04 → 15:09Still racing70%
 Washington & Jefferson7 marks from 5 athletes · small sample1.1s slower1500m4:07.7 → 4:00.7800m–5000m–Still racing83%
 Williams13 marks from 12 athletes1.2s slower1500m4:03.1 → 4:06.5800m–5000m14:58 → 14:38Still racing94%
 Dickinson College10 marks from 9 athletes1.4s slower1500m4:04.0 → 4:12.2800m–5000m15:25 → 15:20Still racing90%
 Trinity TX15 marks from 8 athletes1.4s slower1500m4:02.4 → 4:03.1800m1:56.2 → 1:57.35000m15:16 → 14:56Still racing80%
 Oberlin8 marks from 5 athletes · small sample1.4s slower1500m4:02.9 → 3:57.7800m1:59.5 → 2:00.85000m–Still racing100%
 Trine12 marks from 8 athletes1.6s slower1500m4:07.5 → 4:07.4800m1:58.4 → 1:58.05000m15:18 → 15:16Still racing73%
 Union NY6 marks from 5 athletes · small sample1.6s slower1500m–800m1:58.2 → 1:58.45000m–Still racing100%
 John Carroll25 marks from 16 athletes1.7s slower1500m4:02.7 → 3:56.0800m1:56.7 → 1:56.75000m15:14 → 14:52Still racing94%
 Vassar6 marks from 6 athletes · small sample1.7s slower1500m–800m–5000m15:16 → 15:02Still racing70%
 Grinnell8 marks from 4 athletes · small sample1.7s slower1500m4:05.5 → 4:05.6800m1:56.7 → 1:56.55000m–Still racing100%
 Middlebury14 marks from 11 athletes1.8s slower1500m4:03.3 → 4:03.0800m1:55.2 → 1:54.65000m15:08 → 15:19Still racing73%
 Central College7 marks from 6 athletes · small sample1.9s slower1500m4:03.2 → 4:03.0800m–5000m–Still racing75%
 Washington U22 marks from 15 athletes1.9s slower1500m4:04.2 → 4:03.4800m1:58.4 → 1:57.15000m15:07 → 15:15Still racing88%
 Ursinus9 marks from 6 athletes · small sample2.0s slower1500m4:04.6 → 4:04.3800m1:57.0 → 1:55.35000m–Still racing100%
 Amherst22 marks from 16 athletes2.0s slower1500m4:04.2 → 4:00.6800m1:54.0 → 1:55.65000m14:57 → 15:02Still racing94%
 McDaniel6 marks from 4 athletes · small sample2.3s slower1500m4:03.3 → 4:13.2800m1:58.9 → 2:00.05000m–Still racing100%
 Berry7 marks from 5 athletes · small sample2.3s slower1500m–800m1:59.6 → 2:02.35000m–Still racing83%
 Messiah9 marks from 6 athletes · small sample2.5s slower1500m3:59.2 → 3:58.7800m1:57.7 → 1:58.05000m–Still racing100%
 Lynchburg18 marks from 10 athletes2.5s slower1500m4:02.7 → 3:58.4800m1:55.2 → 1:56.95000m14:55 → 15:04Still racing79%
 Baldwin Wallace8 marks from 5 athletes · small sample2.5s slower1500m4:07.3 → 4:18.7800m1:57.7 → 2:04.55000m–Still racing86%
 St Lawrence7 marks from 6 athletes · small sample2.6s slower1500m4:07.6 → 4:14.9800m–5000m–Still racing75%
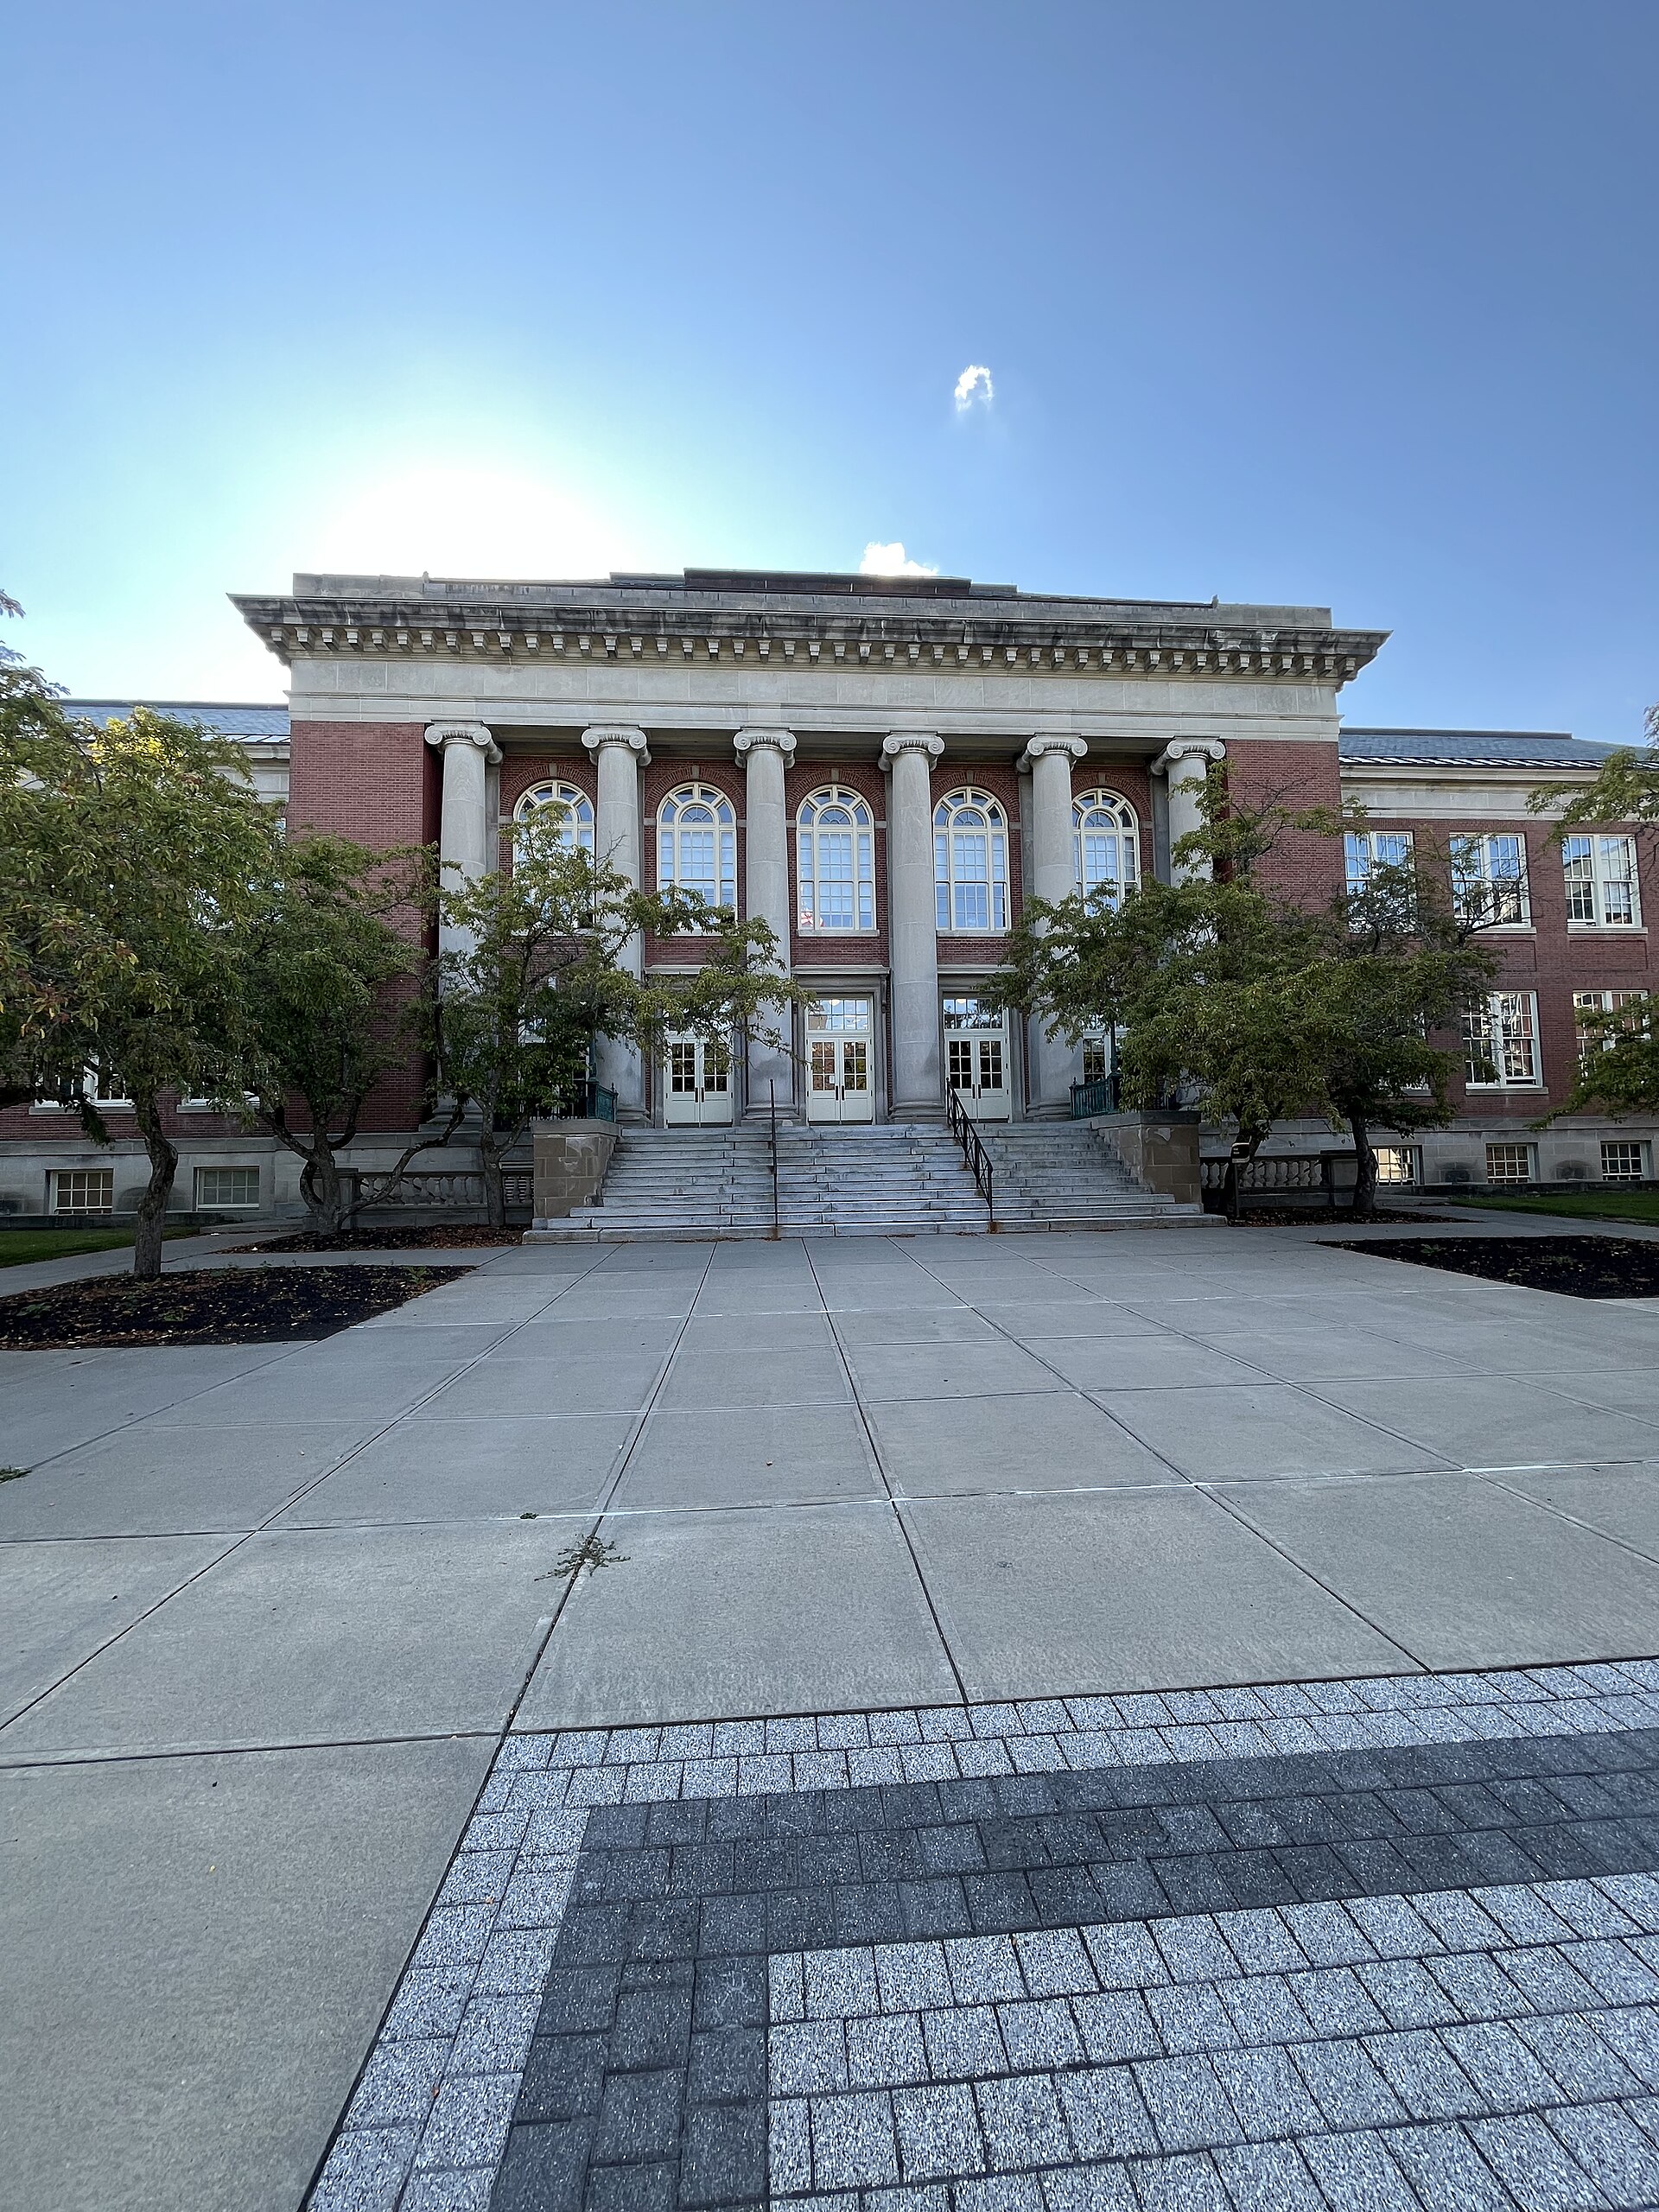 Cortland St8 marks from 5 athletes · small sample2.7s slower1500m4:03.5 → 4:12.8800m–5000m15:37 → 15:29Still racing71%
 Christopher Newport8 marks from 5 athletes · small sample2.9s slower1500m–800m1:57.4 → 2:02.25000m–Still racing100%
 Carleton10 marks from 6 athletes2.9s slower1500m4:01.9 → 4:05.1800m1:57.3 → 1:56.05000m–Still racing100%
 Washington & Lee11 marks from 9 athletes3.7s slower1500m4:04.0 → 4:06.9800m–5000m15:21 → 15:07Still racing100%
 Augustana IL7 marks from 5 athletes · small sample3.9s slower1500m4:06.3 → 4:09.6800m–5000m–Still racing100%
 La Verne12 marks from 7 athletes4.2s slower1500m3:59.9 → 4:03.5800m1:57.4 → 1:58.05000m15:02 → 15:42Still racing78%
Not enough data to rank yet: 91 programs
These programs have athletes at this level but fewer than 6 junior-year marks in our window. That is a statement about sample size, not about the program.
- Case Western5 marks
- Centre5 marks
- Cornell College5 marks
- DeSales5 marks
- Hamilton5 marks
- Millikin5 marks
- Misericordia5 marks
- Nebraska Wesleyan5 marks
- Ohio Wesleyan5 marks
- Penn State Behrend5 marks
- Puget Sound5 marks
- Redlands5 marks
- Suffolk5 marks
- Susquehanna5 marks
- Trinity CT5 marks
- Utica5 marks
- Wheaton IL5 marks
- Widener5 marks
- Colby4 marks
- Conn College4 marks
- Eastern Conn St4 marks
- Illinois Wesleyan4 marks
- Keene State4 marks
- LeTourneau4 marks
- Linfield4 marks
- Luther4 marks
- Muhlenberg4 marks
- Nazareth4 marks
- RIT4 marks
- Roger Williams4 marks
- St Scholastica4 marks
- Stockton4 marks
- WPI4 marks
- Willamette4 marks
- Wisconsin Lutheran4 marks
- Bridgewater St3 marks
- Caltech3 marks
- Capital3 marks
- Carthage3 marks
- Concordia Moorhead3 marks
- Dubuque3 marks
- Elizabethtown3 marks
- Ithaca3 marks
- Mary Washington3 marks
- Oglethorpe3 marks
- Pacific Lutheran3 marks
- Ramapo3 marks
- Rhodes3 marks
- Ripon3 marks
- Rochester3 marks
- Southern Virginia3 marks
- St Norbert3 marks
- Stevens3 marks
- Wis River Falls3 marks
- Wooster3 marks
- Babson2 marks
- Catholic2 marks
- Coast Guard2 marks
- Concordia WI2 marks
- Denison2 marks
- Eastern2 marks
- Franklin2 marks
- Geneva2 marks
- Gordon2 marks
- Houghton2 marks
- Kalamazoo2 marks
- Kenyon2 marks
- Kings2 marks
- Manchester2 marks
- McMurry2 marks
- Simpson2 marks
- Southern Maine2 marks
- Springfield2 marks
- Transylvania2 marks
- Wentworth Institute of Tech2 marks
- York PA2 marks
- Alfred State1 marks
- Bethel MN1 marks
- Buffalo State1 marks
- Elmhurst1 marks
- Grove City1 marks
- Hartford1 marks
- Pfeiffer1 marks
- Plattsburgh St1 marks
- RIC1 marks
- Roanoke1 marks
- ST Thomas TX1 marks
- Salisbury1 marks
- Beloit0 marks
- Fredonia St0 marks
- Texas Lutheran0 marks
How to read this
- The two times are the program’s typical (median) first-college-season mark and the same athletes’ typical mark as juniors or seniors (their third and fourth college years).
- Faster / slower compares a program’s runners with D3 runners elsewhere who started college with the same times. “3.0s faster” means they ended up 3 seconds ahead of where those similar runners did. On the all-distance board the three events are combined and shown as seconds in a 1500m; pick one event to see it in that event’s own seconds.
- Still racing is the share of those athletes with a college race that year or later. A program can rank well on the athletes who stay and still lose a lot of them.
- Small sample means fewer than 10 marks. One athlete can move that program several places.
How it is measured
- Official college meet results, fall 2021 through fall 2023 entering classes for junior year, fall 2021 and 2022 for senior year. Updated November 17, 2026.
- The starting line is an athlete’s first college season racing the event, so a redshirt year does not count against a program.
- Each athlete is compared with D3 athletes who started within about 1% of the same mark in the same year. A program’s score is the average gap, pulled toward zero when the sample is small.
- College meets only. Summer and professional races are not counted, so the very fastest athletes are understated. Transfers are measured at the program they entered as freshmen.
- Rankings like this shift from one set of classes to the next. Treat neighbors in the table as roughly level.
Which of these programs fit your times?
The free Reality Report measures your athlete’s marks against what each division’s programs actually sign. Every school page has its own Development tab with the full event-by-event picture.
Get the free Reality Report →Ready to build your athlete's future?
Start with the honest read — where your athlete’s marks actually fit across D1, D2, D3 and NAIA.
Free · No account · No credit card